


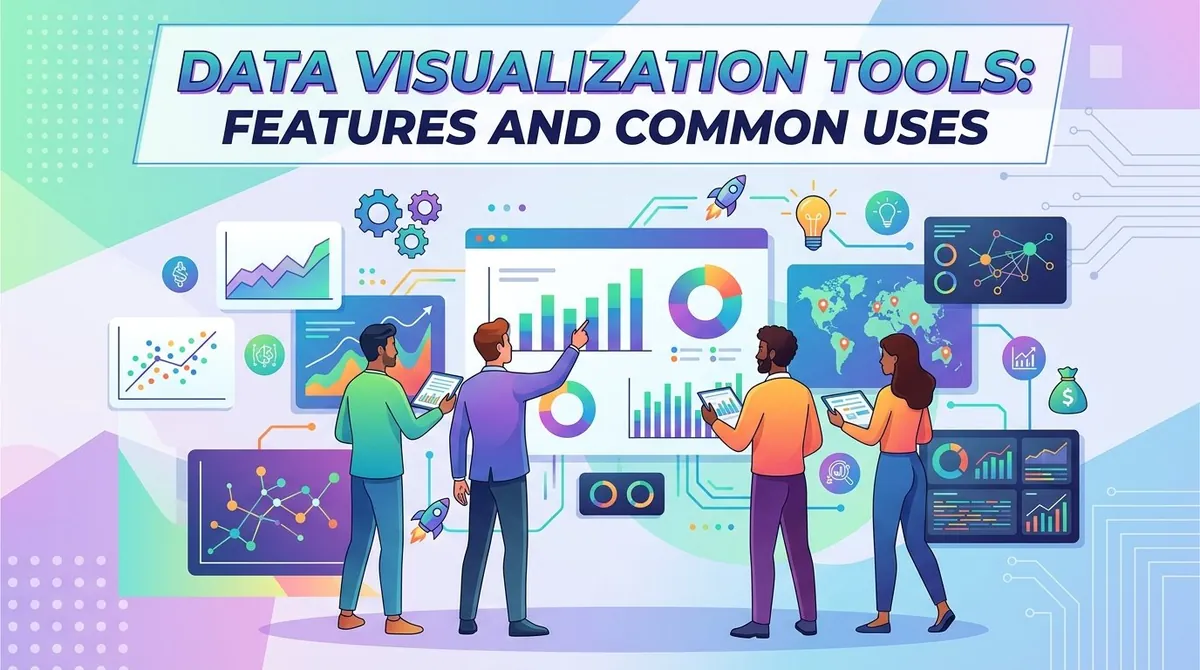
Organizations collect data from sales systems, customer platforms, financial software, websites, and operational databases. As the amount of information increases, presenting that data clearly becomes an important part of analysis and reporting.
Data visualization tools help users turn datasets into charts, graphs, dashboards, maps, and other visual formats. These tools can make trends, comparisons, patterns, and relationships easier to identify than they may be when reviewing raw tables of information. IBM describes data visualization as "the graphical representation of information through formats such as charts, plots, and infographics."
Different tools offer different capabilities. Some are designed for straightforward reporting, while others provide interactive dashboards, advanced analytics, data connections, and business intelligence features.
Understanding Data Visualization Tools
Data visualization tools are software applications that help users represent information visually. The goal is generally to make data easier to understand and communicate.
Common visualization formats include:
- Bar charts
- Line charts
- Pie charts
- Scatter plots
- Maps
- Tables and matrices
- Dashboards
- KPI displays
The appropriate format depends on the type of data and the question being analyzed. A line chart, for example, can show changes over time, while a bar chart can make comparisons between categories easier.
Key Features of Data Visualization Tools
**Interactive Dashboards**
Interactive dashboards allow users to view multiple metrics and visualizations in one place. A business dashboard might display revenue, customer activity, sales performance, or operational indicators.
Users can often apply filters, change time periods, or explore individual categories without creating a separate report for each question.
Microsoft Power BI, for example, "supports interactive reports and dashboards that allow users to filter and explore information."
**Multiple Chart Types**
Most visualization platforms provide different chart types for different analytical purposes.
Bar charts can be useful for comparing categories. Line charts can illustrate changes and trends over time. Scatter plots can help show relationships between numerical variables. Maps can be useful when geographic information is relevant.
Selecting the appropriate visualization can make the underlying information easier for the intended audience to interpret.
**Data Connections**
Visualization tools often connect to multiple data sources, including spreadsheets, databases, cloud applications, and business systems.
These connections can reduce the need to manually combine information before creating reports.
Microsoft notes that "data visualization tools can connect to different types of data sources, including databases, files, and business applications."
**Filtering and Drill-Down**
Filtering allows users to focus on specific portions of a dataset. For example, a sales dashboard could be filtered by region, product, salesperson, or date.
Drill-down features can provide additional detail behind a high-level result. This can allow users to move from an overall performance figure to the specific categories or records contributing to it.
**Sharing and Collaboration**
Many visualization platforms allow users to publish and share dashboards or reports with other employees.
Sharing capabilities can include permissions, shared workspaces, browser-based access, and scheduled reporting. These features can help teams work from consistent information rather than relying on individually maintained spreadsheets.
Common Uses of Data Visualization
Data visualization can be used across many departments and industries.
Business reporting: Organizations can visualize revenue, costs, sales, and other performance indicators. Marketing analysis: Marketing teams can examine campaign results, website traffic, customer acquisition, and engagement. Financial analysis: Finance teams can use visualizations to review expenses, budgets, revenue, and financial trends. Operations: Operational teams can monitor inventory, productivity, supply chains, and service performance. Customer analysis: Businesses can visualize customer behavior, purchasing patterns, retention, and other customer metrics. Management reporting: Executives and managers can use dashboards to review high-level performance and monitor key indicators.
Visualization can make large datasets easier to review, but the usefulness of the result depends on both the quality of the underlying data and the way it is presented.
Data Visualization for Decision-Making
One purpose of visualization is to make important information easier to recognize.
A spreadsheet may contain thousands of individual values, while a chart can highlight a trend or comparison more directly. A line chart can show whether sales are increasing or decreasing over several months, while a bar chart can compare performance across different regions.
Dashboards can also bring several related metrics together, allowing users to review multiple aspects of performance in one place.
Visualization does not replace analysis. Users still need to understand where the data came from, whether it is reliable, and what conclusions can reasonably be drawn from it.
Choosing a Data Visualization Tool
Organizations comparing visualization tools can consider several factors:
- Data sources: Check whether the platform connects to the required databases, files, and applications.
- Visualization options: Review available charts, dashboards, maps, and other formats.
- Interactivity: Consider filtering, drill-downs, and other interactive features.
- Ease of use: Determine whether employees can create and understand reports without extensive technical training.
- Collaboration: Review sharing, permissions, and team-access features.
- Scalability: Consider whether the tool can handle increasing amounts of data and users.
- Security: Evaluate access controls and other security requirements.
- Cost: Consider licensing, implementation, training, and ongoing expenses.
The intended users should also be considered. A data analyst may require more advanced functionality than an executive who primarily needs a small number of performance dashboards.
Common Data Visualization Platforms
Several established platforms provide data visualization capabilities.
Microsoft Power BI provides interactive reports, dashboards, data connections, and business intelligence functionality.
Tableau is a visual analytics platform designed to help users explore and communicate information through interactive visualizations.
Looker Studio provides customizable reports and dashboards that can include charts, tables, and interactive controls.
The appropriate platform depends on an organization's existing systems, data requirements, budget, and technical environment.
Data Visualization Best Practices
Effective visualization is not necessarily about using the most charts or the most elaborate design.
A visualization should have a clear purpose and make the relevant information easy to identify. The audience and the question being answered can help determine which data and visual format should be used.
Organizations can also avoid overcrowding dashboards with unnecessary elements. Too many charts or competing visual signals can make important information harder to identify.
Tableau recommends "considering the audience, the questions they need answered, and the purpose of the visualization when designing data visualizations."
Final Thoughts
Data visualization tools can help organizations turn datasets into charts, dashboards, reports, and other visual formats. Features such as interactive dashboards, multiple chart types, data connections, filtering, drill-downs, and collaboration can support a variety of analytical and reporting activities.
The most appropriate tool depends on an organization's data sources, users, technical requirements, budget, and reporting objectives. Comparing these factors can help businesses select software that fits their current needs while allowing room for future growth.
Ultimately, effective data visualization is about presenting information clearly. When the right data is combined with an appropriate visual format, organizations can make complex information easier to understand and use in everyday analysis.
References
- IBM. "What Is Data Visualization?"
- IBM — Data Visualization
- Microsoft Power BI. "Data Visualization Tools."
- Microsoft Power BI — Data Visualization Tools
- Microsoft Power BI. "Power BI Overview."
- Microsoft — Power BI Overview
- Tableau. "What Is Tableau?"
- Tableau — What Is Tableau?
- Google Cloud. "Looker Studio."
- Google Cloud — Looker Studio