


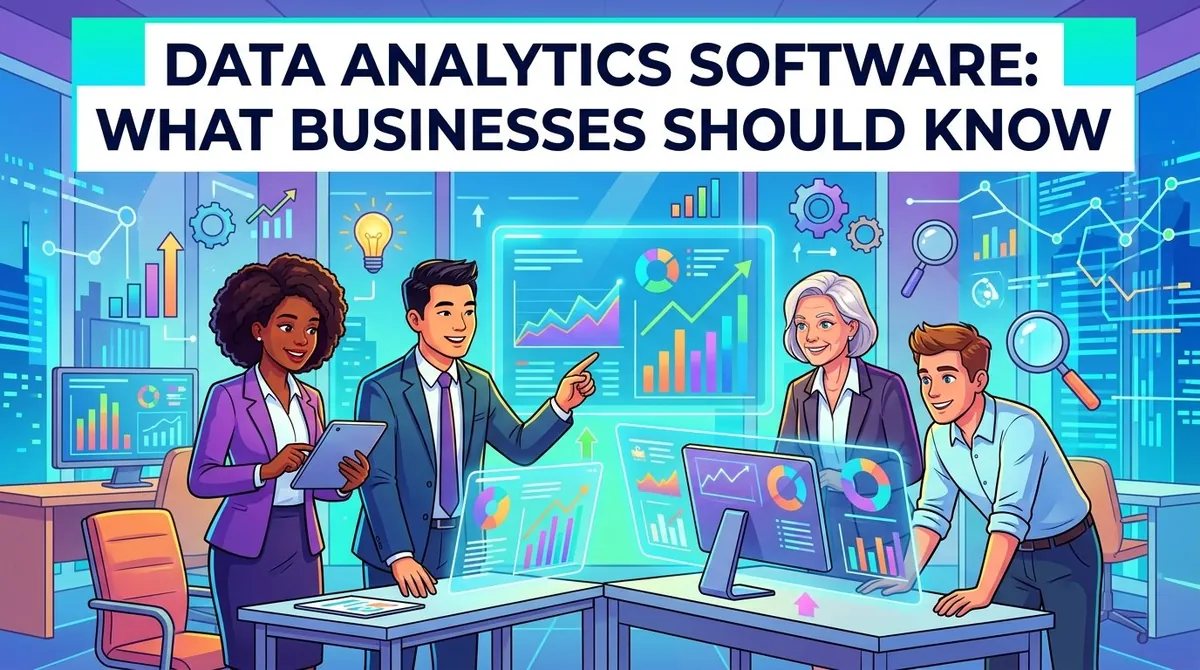
Businesses generate information across sales, marketing, finance, customer service, operations, and other activities. As organizations collect more data, spreadsheets and manually prepared reports can become difficult to manage. Data analytics software can help businesses organize information, analyze datasets, identify patterns, and present findings in a way that supports business decisions.
Data analytics software can range from spreadsheet-based tools to comprehensive analytics and business intelligence platforms. Depending on the solution, businesses may be able to connect multiple data sources, clean and transform information, create dashboards, perform statistical analysis, and share results with other users.
The appropriate software depends on an organization's data environment, technical requirements, budget, and the types of questions employees need to answer.
Understanding Data Analytics Software
Data analytics software provides tools for examining and working with data. It can help users move from raw information toward reports, visualizations, trends, and other analytical results.
Some platforms focus primarily on statistical analysis, while others combine data preparation, visualization, reporting, and business intelligence capabilities.
Common uses include:
- Analyzing sales performance
- Tracking marketing results
- Evaluating financial information
- Monitoring operations
- Understanding customer behavior
- Creating business reports
- Identifying trends
- Supporting forecasting
Modern analytics platforms can also connect information from different sources. Microsoft describes Power BI, for example, as a business analytics platform that connects, visualizes, and shares data across organizations. (Microsoft)
Key Features of Data Analytics Software
Data Integration
Businesses often store information across different systems. Data analytics software can connect to databases, spreadsheets, cloud services, business applications, and other sources.
Bringing information together can make it easier to analyze data across departments and reduce the need to manually combine separate files.
Microsoft Power BI supports connections to more than 100 data sources, including databases, cloud services, files, and web sources. (Microsoft)
Data Preparation
Raw data may contain duplicate records, missing values, inconsistent formats, or other issues that need to be addressed before analysis.
Data preparation features can help users clean, transform, combine, and organize information. This can be particularly important when data comes from multiple systems.
The quality of analytical results depends partly on the quality and consistency of the underlying data.
Data Visualization
Visualization allows businesses to present information through charts, graphs, dashboards, and other formats.
A sales team might use a dashboard to monitor revenue by region, while a marketing department could visualize campaign performance over time.
Visualization can make comparisons and trends easier to identify, particularly when users are working with large datasets.
Reporting and Dashboards
Reporting tools allow businesses to create recurring or customized reports. Dashboards can bring multiple metrics together in one interface.
For example, an executive dashboard might display revenue, expenses, customer growth, and other key performance indicators.
Interactive dashboards can also allow users to filter information or drill into specific categories.
Statistical and Predictive Analysis
More advanced analytics software can provide statistical analysis, forecasting, predictive modeling, or machine learning capabilities.
These functions can help organizations examine relationships within data and develop estimates about potential future outcomes.
IBM describes modern analytics platforms as supporting statistical analysis, predictive insights, interactive dashboards, and machine learning alongside data visualization and business intelligence. (IBM)
The level of advanced analytics varies considerably between platforms.
Common Applications for Businesses
Data analytics software can be applied across many areas of an organization.
Sales: Businesses can analyze revenue, sales pipelines, conversion rates, and customer activity.
Marketing: Teams can evaluate campaign performance, website traffic, acquisition, and engagement.
Finance: Analytics can support budgeting, expense analysis, financial reporting, and forecasting.
Operations: Organizations can monitor productivity, inventory, supply chains, and service performance.
Customer analysis: Businesses can examine purchasing patterns, retention, customer segments, and behavior.
Management: Leaders can use dashboards and reports to monitor performance and identify areas requiring further analysis.
The specific applications depend on the organization's objectives and the data available to it.
Data Analytics Software vs. Business Intelligence Software
The terms data analytics software and business intelligence software are sometimes used interchangeably, but they can describe different areas of functionality.
Business intelligence generally emphasizes reporting, dashboards, visualization, and monitoring business performance.
Data analytics can encompass a broader range of activities, including statistical analysis, data preparation, predictive modeling, and other analytical methods.
There is significant overlap between the two categories. Many modern platforms combine analytics and business intelligence features in the same environment.
For example, Microsoft Power BI provides data preparation, modeling, visualization, reporting, dashboards, sharing, and security capabilities. (Microsoft)
Security and Data Governance
Businesses should also consider how analytics software manages access to information.
Depending on the type of data being analyzed, organizations may require user permissions, authentication, access controls, security policies, and governance features.
Data governance can help businesses maintain consistent definitions and standards across reports. This can be particularly important when different departments use the same metrics.
Microsoft identifies security, governance, and access management as components of its analytics platform, while IBM emphasizes governance and privacy alongside self-service analytics. (Microsoft; IBM)
How to Choose Data Analytics Software
Businesses comparing analytics platforms can consider several factors:
- Data sources: Determine which databases, files, and applications the software can connect to.
- Data preparation: Review tools for cleaning, transforming, and combining information.
- Visualization: Check the available charts, dashboards, and interactive features.
- Analytics: Determine whether statistical, predictive, or machine learning capabilities are required.
- Ease of use: Consider whether employees can work with the platform without extensive technical training.
- Security: Review permissions, governance, and data protection features.
- Scalability: Consider whether the software can handle future growth in data and users.
- Integration: Check compatibility with existing business systems.
- Cost: Consider licensing, implementation, training, and ongoing expenses.
Businesses may also benefit from testing a platform with real datasets before making a final decision.
Popular Data Analytics Platforms
Several established platforms provide analytics capabilities, although their features and intended users differ.
Microsoft Power BI combines data preparation, modeling, visualization, reporting, dashboards, sharing, and business intelligence features. (Microsoft)
Tableau provides visual analytics and tools for exploring and communicating data. Its platform includes data connections, visualization, data preparation, governance, and analytical capabilities. (Tableau)
IBM analytics solutions cover areas including business intelligence, statistical analytics, predictive insights, data management, and AI-powered analytics. (IBM)
The appropriate platform depends on the organization's requirements rather than simply the number of features available.
Final Thoughts
Data analytics software can help businesses organize information, analyze datasets, visualize results, and support decisions across different departments. Features such as data integration, preparation, visualization, reporting, predictive analysis, security, and governance can all influence how useful a platform becomes.
Businesses should evaluate software based on their actual data sources, users, analytical requirements, existing technology, and expected growth. A platform with extensive features may not be necessary for an organization that primarily needs straightforward reporting, while businesses with complex data environments may require more advanced capabilities.
Ultimately, the purpose of data analytics software is to help organizations work with information more effectively. Choosing a platform that fits the organization's needs can make it easier to turn business data into useful analysis and actionable information.
References
- Microsoft. "What Is Power BI?"
- Microsoft — Power BI Overview
- Microsoft Power BI. "Power BI."
- Microsoft — Power BI
- IBM. "Analytics Software, Solutions and Tools."
- IBM — Analytics Software
- Tableau. "Tableau vs. Microsoft Power BI."
- Tableau — Tableau vs. Power BI