


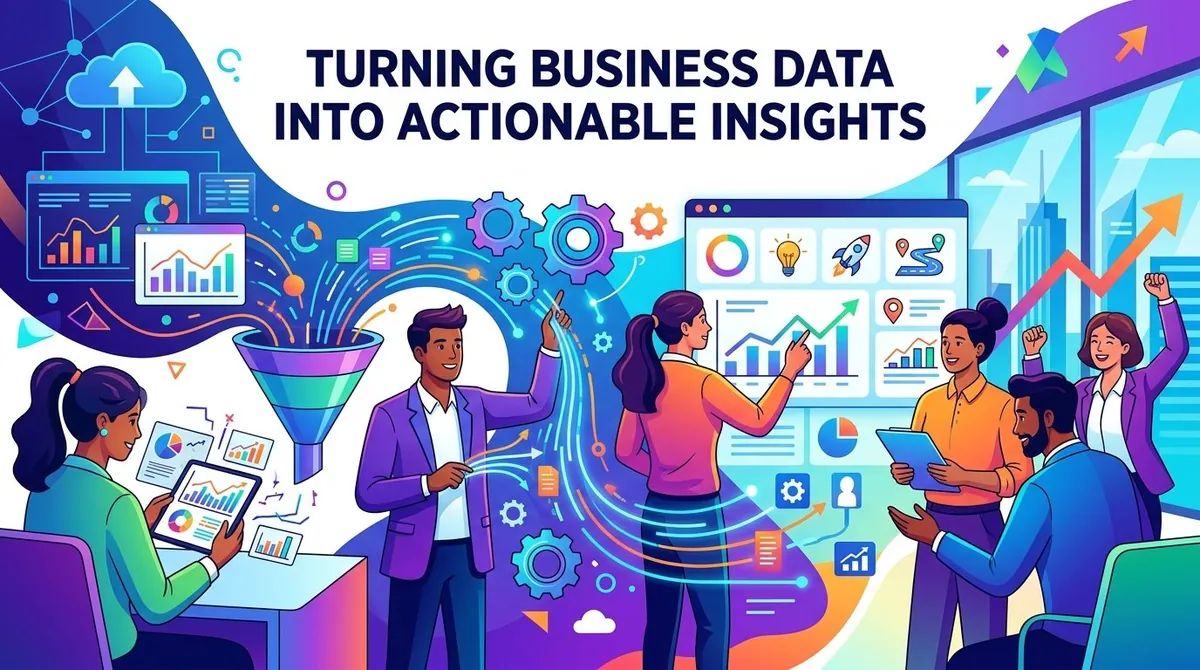
In today's business environment, organizations generate information from almost every activity, including customer interactions, sales transactions, marketing campaigns, financial operations, and supply chains. Yet having large volumes of business data does not automatically lead to better outcomes. The real advantage comes from understanding what the data means and translating those findings into practical decisions.
Turning business data into actionable insights requires more than dashboards or reports. It involves asking the right questions, collecting reliable information, identifying meaningful patterns, and connecting data analysis to specific business objectives. When managed effectively, data can help organizations understand performance, identify opportunities, anticipate challenges, and make more informed decisions.
From Raw Data to Business Insight
Business data often begins as disconnected records: transactions, customer interactions, website activity, operational measurements, financial figures, or marketing results. On their own, these individual data points may have limited meaning.
The first step in business data analysis is to organize and contextualize the information. Business intelligence processes commonly involve collecting data from multiple sources, transforming it into a usable format, analyzing it, and presenting the results in a way decision-makers can understand.
The distinction between data, information, insight, and action is important:
- Data: Individual facts, measurements, or observations.
- Information: Data organized with structure and context.
- Insight: An interpretation of patterns and what they may mean.
- Action: A decision or operational change based on the insight.
For example, knowing that online sales declined is data. Identifying that the decline occurred primarily among returning customers after a website change provides a more useful insight. Testing an improvement to the affected customer journey turns that insight into action.
The Building Blocks of Actionable Analytics
Creating useful business insights depends on several interconnected practices.
Start With a Clear Business Question
Analytics becomes more useful when it begins with a defined business problem rather than an attempt to analyze everything available.
Questions might include:
- Why are sales changing in a particular market?
- Which customer segments generate the greatest value?
- Where are operational costs increasing?
- Which marketing channels contribute most effectively to conversions?
- What factors are associated with customer retention?
Starting with the decision that needs to be made helps determine which information is actually relevant. IBM recommends defining objectives before identifying, preparing, and analyzing the data needed to support a decision.
Build Reliable Data Foundations
An insight is only as dependable as the information behind it. Inconsistent definitions, duplicated records, missing values, outdated information, or disconnected systems can produce misleading conclusions.
Organizations should establish clear ownership of important datasets and consistent definitions for key metrics. Data preparation can include removing duplicates, correcting formatting issues, validating records, and combining information from multiple systems.
Modern business intelligence platforms can connect information from different sources and support data preparation, modeling, analysis, and visualization.
Identify Patterns and Relationships
Once data has been prepared, business data analytics can reveal patterns that are difficult to see in raw tables.
Descriptive analytics can explain what happened, diagnostic analysis can explore why it happened, predictive techniques can estimate potential future outcomes, and prescriptive approaches can help evaluate possible actions.
This progression allows businesses to move from simply reporting performance toward understanding its causes and considering what might happen next.
Making Data Understandable Through Visualization
Even sophisticated analysis has limited value if decision-makers cannot easily interpret it.
Data visualization for business can make relationships and changes easier to identify. Dashboards, charts, trend lines, and comparison tables can help managers see performance against targets, recognize unusual movements, compare business units, and identify areas that require further investigation.
Useful business dashboards may include:
- Revenue and margin trends
- Customer acquisition and retention
- Marketing conversion rates
- Operational performance indicators
- Inventory or supply-chain measures
- Budget versus actual performance
The objective is not to create the most complicated dashboard possible. It is to make important information easier to understand and connect it to decisions.
From Insight to Action
The most important step often happens after analysis.
An organization may discover that one customer segment has a higher retention rate than another. The finding itself is useful, but it does not create a business outcome automatically.
A practical approach is to investigate what differentiates the stronger segment, test whether similar practices can be applied elsewhere, and measure the results.
A useful framework is:
Finding → Interpretation → Decision → Action → Measurement
This creates a feedback loop. After an action is implemented, new data can be collected to determine whether the expected result occurred.
The purpose of data-driven decision making is therefore not simply to produce another report or dashboard. It is to provide evidence that supports decisions and allows organizations to evaluate their results.
Real-World Applications
Actionable business insights can support decisions across different functions.
Marketing teams can analyze campaign performance, customer journeys, conversion rates, and channel behavior to identify opportunities for improvement.
Sales teams can examine historical performance, customer segments, pipeline information, and product data to identify purchasing patterns and evaluate opportunities.
Operations teams can use data to identify bottlenecks, delays, capacity constraints, and recurring problems. Monitoring these indicators over time can help determine where process improvements may have the greatest effect.
Finance teams can combine revenue, costs, margins, cash flow, and forecasts with operational and customer information to gain broader context for planning.
Customer experience teams can analyze feedback, support interactions, product usage, and retention data to identify recurring friction points and prioritize improvements.
Across these functions, the objective remains the same: use reliable information to understand performance and support better decisions.
Implementation Roadmap and Best Practices
Building a data-driven decision process does not require transforming the entire organization at once. Consider these practical steps:
- Define the objective: Identify a specific business decision or problem where better information could create value.
- Identify relevant data: Determine which internal and external datasets can help answer the question.
- Prepare and validate: Check data quality, establish consistent definitions, and document important assumptions.
- Analyze: Use appropriate analytical methods to identify trends, relationships, anomalies, and potential explanations.
- Communicate: Present findings in a format appropriate for the people making the decision.
- Act and measure: Translate the insight into a specific action and evaluate the outcome.
This phased approach helps make analytics part of everyday business management rather than an isolated reporting activity.
Overcoming Common Challenges
Turning data into useful business insights can encounter several challenges.
Poor data quality can lead to unreliable conclusions. Organizations need processes for validating and maintaining important datasets.
Data silos can make it difficult to establish a complete picture of performance. Information distributed across separate systems may need to be integrated before meaningful analysis can occur.
Too many metrics can create confusion rather than clarity. A dashboard containing hundreds of indicators may make it harder to identify what actually requires attention.
Misinterpretation is another risk. Data does not automatically establish causation, and a correlation between two variables does not necessarily mean that one caused the other. Harvard Business Review has discussed the risks involved when organizations either over-rely on evidence or fail to interpret it appropriately.
Finally, organizations can experience analysis paralysis when teams continue gathering information without moving toward a decision. More data is not always better data; the goal is to obtain information that helps answer the business question at hand.
The Future of Business Analytics
The role of business data continues to evolve as organizations gain access to more sophisticated analytics, automation, artificial intelligence, and real-time information.
Modern analytics platforms increasingly combine data preparation, visualization, predictive capabilities, and AI-assisted analysis. These technologies can help users identify patterns, investigate anomalies, and explore potential outcomes more efficiently.
However, technology does not eliminate the need for human judgment. Business leaders still need to determine which questions matter, assess the quality of evidence, consider context, and decide how an organization should respond.
The organizations that benefit from their data are not necessarily those that collect the most information. They are the ones that can consistently connect reliable data to meaningful questions, understandable insights, deliberate decisions, and measurable actions.
Turning business data into actionable insights is ultimately a continuous process. As new information becomes available and business conditions change, organizations can refine their questions, improve their analysis, test new approaches, and learn from the results.
References
- IBM. "What Is Data-Driven Decision-Making?"
- IBM. "Data Intelligence."
- Microsoft. "What Is Business Intelligence?"
- Microsoft. "What Is Power BI?"
- Microsoft. "What Is Data Visualization?"
- Microsoft. "Business Analytics Tools and Why They Matter."
- McElheran, Kristina, and Erik Brynjolfsson. "The Rise of Data-Driven Decision Making Is Real but Uneven." Harvard Business Review, 2016.
- Luca, Michael, and Amy C. Edmondson. "Where Data-Driven Decision-Making Can Go Wrong." Harvard Business Review, 2024.